Cranbourne North (PSP)
Highest level of schooling
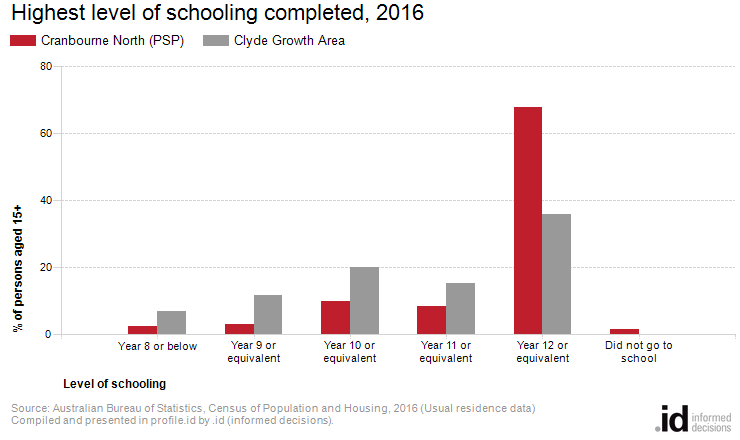
In Cranbourne North (PSP), 68.0% of people aged over 15 years had completed Year 12 schooling (or equivalent) as of 2016. This was greater than Clyde Growth Area.
Cranbourne North (PSP)'s school completion data is a useful indicator of socio-economic status. With other indicators, such as Proficiency in English, the data informs planners and decision-makers about people's ability to access services. Combined with Educational Qualifications it also allows assessment of the skill base of the population.
Derived from the Census question:
'What is the highest year of primary or secondary school the person has completed?'
Persons aged 15 years and over
| Highest level of secondary schooling completed | ||||||||
|---|---|---|---|---|---|---|---|---|
| Cranbourne North (PSP) - Total persons (Usual residence) | 2016 | 2006 | Change | |||||
| Level of schooling | Number | % | Clyde Growth Area % | Number | % | Clyde Growth Area % | 2006 to 2016 | |
| Year 8 or below | 44 | 2.4 | 6.8 | 6001 | 2 | 9.5 | 8.6 | +42 |
| Year 9 or equivalent | 56 | 3.0 | 11.7 | 6002 | 3 | 13.3 | 12.1 | +53 |
| Year 10 or equivalent | 186 | 10.0 | 20.2 | 6003 | 5 | 22.0 | 21.7 | +180 |
| Year 11 or equivalent | 154 | 8.3 | 15.2 | 6004 | 3 | 13.0 | 16.6 | +151 |
| Year 12 or equivalent | 1,260 | 68.0 | 36.0 | 6005 | 7 | 27.9 | 28.9 | +1,253 |
| Did not go to school | 29 | 1.6 | -- | 6006 | 0 | 0.0 | 1.1 | +30 |
| Not stated | 122 | 6.6 | 10.1 | 6007 | 3 | 14.4 | 11.1 | +119 |
| Total persons aged 15+ | 1,854 | 100.0 | 100.0 | 25 | 100.0 | 100.0 | +1,829 | |
Source: Australian Bureau of Statistics, Census of Population and Housing (opens a new window) 2006 and 2016. Compiled and presented by .id (opens a new window)(informed decisions).
Compiled and presented in profile.id by .id (informed decisions).
Compiled and presented in profile.id by .id (informed decisions).
Dominant groups
Analysis of the highest level of schooling attained by the population in Cranbourne North (PSP) in 2016 compared to Clyde Growth Area shows that there was a lower proportion of people who had left school at an early level (Year 10 or less) and a higher proportion of people who completed Year 12 or equivalent.
Overall, 17.1% of the population left school at Year 10 or below, and 68.0% went on to complete Year 12 or equivalent, compared with 38.7% and 36.0% respectively for Clyde Growth Area.
The major differences between the level of schooling attained by the population in Cranbourne North (PSP) and Clyde Growth Area were:
- A larger percentage of persons who completed year 12 or equivalent (68.0% compared to 36.0%)
- A smaller percentage of persons who completed year 10 or equivalent (10.0% compared to 20.2%)
- A smaller percentage of persons who completed year 9 or equivalent (3.0% compared to 11.7%)
- A smaller percentage of persons who completed year 11 or equivalent (8.3% compared to 15.2%)
Emerging groups
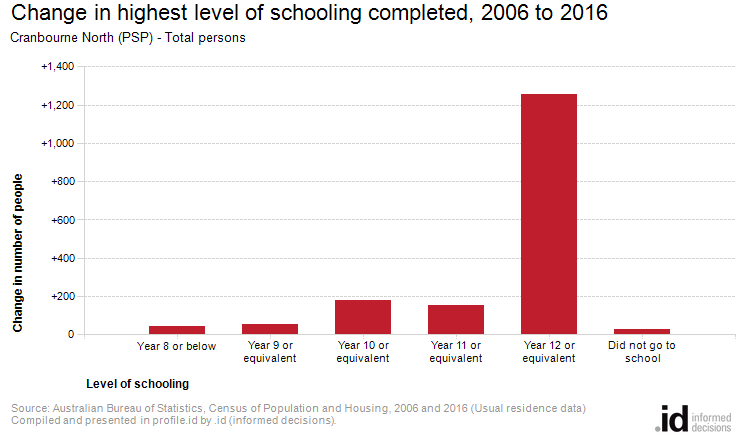
The largest changes in the level of schooling attained by the population in Cranbourne North (PSP), between 2006 and 2016 were:
- Year 12 or equivalent (+1,253 persons)
- Year 10 or equivalent (+180 persons)
- Year 11 or equivalent (+151 persons)
- Year 9 or equivalent (+53 persons)