City of Casey
Recent arrivals - Five year age groups
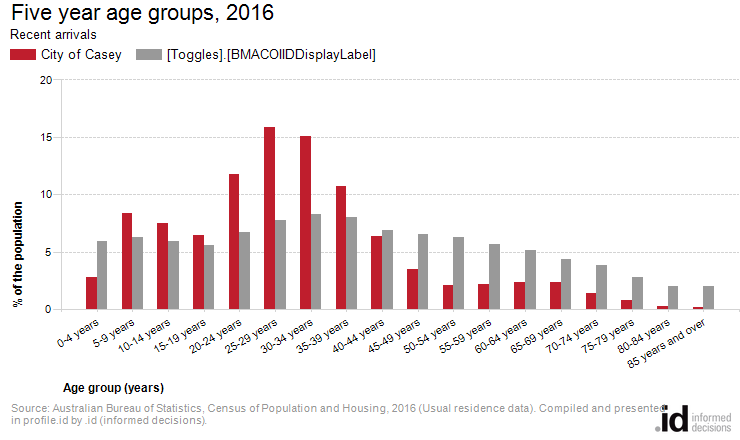
In the City of Casey, 24,657 people arrived in Australia within 5 years prior to 2016, with largest age group being 25-29 years.
The age structure of recent arrivals provides an insight into when people move from overseas to settle in the local area. Generally, recent migrants across Australia are younger than the total population, being concentrated in their 20s, but particular areas may attract more families or older migrants.
Five year age groups present a classic age profile of the population. Each age group covers exactly five years, which enables direct comparison between each group.
To get a more complete picture the City of Casey's Age Structure for recent migrants should be viewed in conjunction with Household Types and Employment Status.
Derived from the Census question:
'What is the person's date of birth or age?'
People born overseas and arriving in Australia between 2016 to 10 Aug 2021
| Five year age groups | |||||||
|---|---|---|---|---|---|---|---|
| City of Casey - Recent arrivals | 2016 | ||||||
| Five year age groups (years) | Number | % | [Toggles].[BMACOIIDDisplayLabel] | ||||
| 0-4 years | 695 | 2.8 | 5.9 | 2201 | |||
| 5-9 years | 2,059 | 8.4 | 6.3 | 2202 | |||
| 10-14 years | 1,841 | 7.5 | 6.0 | 2203 | |||
| 15-19 years | 1,595 | 6.5 | 5.6 | 2204 | |||
| 20-24 years | 2,898 | 11.8 | 6.7 | 2205 | |||
| 25-29 years | 3,915 | 15.9 | 7.8 | 2206 | |||
| 30-34 years | 3,725 | 15.1 | 8.2 | 2207 | |||
| 35-39 years | 2,647 | 10.7 | 8.0 | 2208 | |||
| 40-44 years | 1,564 | 6.3 | 6.9 | 2209 | |||
| 45-49 years | 863 | 3.5 | 6.5 | 2210 | |||
| 50-54 years | 522 | 2.1 | 6.3 | 2211 | |||
| 55-59 years | 538 | 2.2 | 5.7 | 2212 | |||
| 60-64 years | 582 | 2.4 | 5.1 | 2213 | |||
| 65-69 years | 579 | 2.3 | 4.4 | 2229 | |||
| 70-74 years | 341 | 1.4 | 3.9 | 2230 | |||
| 75-79 years | 187 | 0.8 | 2.8 | 2231 | |||
| 80-84 years | 70 | 0.3 | 2.0 | 2232 | |||
| 85 years and over | 36 | 0.1 | 2.0 | 2233 | |||
| Total people | 24,657 | 100.0 | 100.0 | ||||
Source: Australian Bureau of Statistics, Census of Population and Housing (opens a new window) 2016 (Usual residence data). Compiled and presented in profile.id by .id (opens a new window)(informed decisions).
Dominant groups
Analysis of recent overseas arrivals of the City of Casey in 2016 compared to [Parameter].[BMACOIIDLabel] shows that there was a higher proportion of people in the younger age groups (under 15) and a lower proportion of people in the older age groups (65+).
Overall, 18.6% of recent overseas arrivals were aged between 0 and 14, and 4.9% were aged 65 years and over, compared with 18.1% and 15.0% respectively for [Parameter].[BMACOIIDLabel].
The major differences between the recent overseas arriving population age structure of the City of Casey and [Parameter].[BMACOIIDLabel] were:
- A larger percentage of people aged 25-29 years (15.9% compared to 7.8%)
- A larger percentage of people aged 30-34 years (15.1% compared to 8.2%)
- A larger percentage of people aged 20-24 years (11.8% compared to 6.7%)
- A smaller percentage of people aged 50-54 years (2.1% compared to 6.3%)