City of CaseyCommunity profile
Skip to content

Berwick (Township-Beaconsfield)

Ancestry

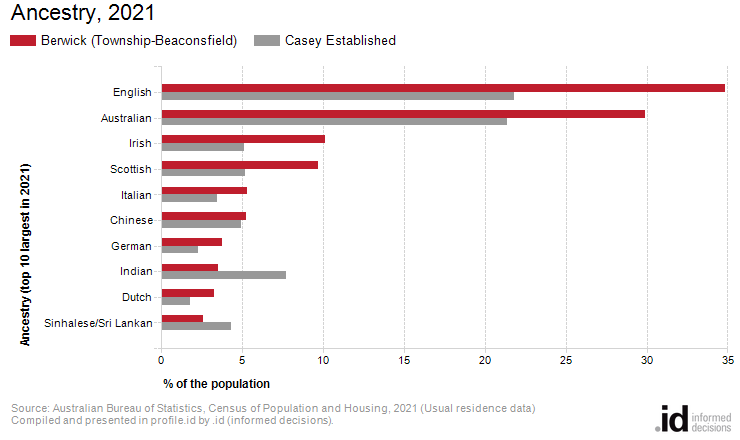
The three largest ancestries in Berwick (Township-Beaconsfield) in 2021 were English, Australian and Irish.

Ancestry defines the cultural association and ethnic background of an individual going back three generations. Ancestry is a good measure of the total size of cultural groups in Berwick (Township-Beaconsfield) regardless of where they were born or what language they speak.

Ancestry data, should be combined with data on Birthplace, Language Spoken at Home and Religion for a more complete picture of Berwick (Township-Beaconsfield)'s ethnic characteristics.

Please note that the "Australian Aboriginal" and "Torres Strait Islander" categories in this topic are not directly comparable from 2021 to previous years, due to a change in the wording of the question. In 2021, these options were marked boxes on the question rather than write-in options. The "Aboriginal and Torres Strait Islander Origin" question is still considered a more reliable count for this group, and can be found on the Population summary page.

Please note: Due to changes in ABS rules around perturbation and additivity of data to protect the confidentiality of individuals, counts of ancestry groups and totals derived from them may differ slightly from those published by the ABS. For more information see notes on data confidentiality.

Derived from the Census question:

'What is the person's ancestry?'

Multi-response

Total population

Ancestry - Totals
Berwick (Township-Beaconsfield) - Total persons (Usual residence)20212011Change
Ancestry totalsNumber%Casey Established %Number%Casey Established %2011 to 2021
Not stated9513.34.81,0533.85.0-103
Total responses28,957----27,408----+1,549

Source: Australian Bureau of Statistics, Census of Population and Housing 2011 and 2021. Compiled and presented by .id (informed decisions).

Ancestry - Ranked by size
Berwick (Township-Beaconsfield) - Total persons (Usual residence)20212011Change
AncestryNumber%Casey Established %Number%Casey Established %2011 to 2021
English
7,53034.821.87,81136.325.8-282
Australian
6,46529.921.47,28133.826.2-816
map this data in atlas.idIrish2,18310.15.12,1209.86.1+63
map this data in atlas.idScottish2,0949.75.22,0669.66.0+28
Italian
1,1395.33.51,1295.23.9+9
Chinese
1,1335.24.93931.83.3+739
German
8063.72.38243.82.7-18
map this data in atlas.idIndian7513.57.73761.75.3+374
Dutch
7073.31.87853.62.4-79
Sinhalese/Sri Lankan
5552.64.33851.83.7+170
Greek
3471.61.62881.31.6+59
Croatian
2941.40.92131.01.0+81
Polish
2571.20.92131.01.1+43
Filipino
2121.02.21590.71.9+53
Maltese
1990.90.61760.80.7+22
Serbian
1990.91.41730.81.4+25
South African
1790.80.52061.00.7-28
Mauritian
1690.81.12171.01.6-49
Hungarian
1690.80.61940.90.9-25
Welsh
1520.70.31290.60.4+22
French
1430.70.61520.70.7-10
Inadequately Described
1420.71.0840.40.6+58
New Zealander
1410.70.71600.70.8-20
Tamil
1250.61.2220.10.4+103
Romanian
1180.50.6840.40.8+33
Afghan
1160.53.7500.22.1+65
Spanish
1130.50.5910.40.7+21
Russian
1110.50.4890.40.4+21
Australian Aboriginal
940.40.6110.10.1+82
Maori
930.40.8850.40.9+7
Chilean
870.40.5660.30.6+21
Korean
820.40.3260.10.1+56
Egyptian
710.30.5400.20.5+31
Punjabi
710.31.570.00.2+64
Vietnamese
690.31.0240.10.7+45
Austrian
680.30.1570.30.2+10
Other Indian subcontinent
680.31.0110.10.3+57
Lebanese
660.30.5480.20.6+18
Bengali/Bangladeshi
640.30.2200.10.1+44
Iranian
600.30.4130.10.1+46
Thai
520.20.3150.10.2+37
Portuguese
500.20.4550.30.3-6
American
490.20.1500.20.2-1
Turkish
480.20.6470.20.7+1
Ukrainian
440.20.1280.10.1+15
Danish
430.20.1400.20.1+2
Pakistani
430.20.9250.10.4+17
Seychellois
400.20.1120.10.1+28
Anglo-Indian
370.20.4450.20.5-8
Sikh
360.20.8--------
Canadian
340.20.0270.10.1+7
Macedonian
340.20.2290.10.2+4
Samoan
310.11.3160.10.9+15
Swiss
300.10.0160.10.1+14
Bosnian
300.10.4220.10.3+8
Finnish
290.10.0270.10.1+2
Swedish
290.10.0230.10.1+6
Cypriot
270.10.1140.10.1+12
Fijian
260.10.5180.10.4+8
Indonesian
260.10.3310.10.3-5
Norwegian
250.10.0140.10.1+11
Palestinian
240.10.1160.10.1+8
Peruvian
230.10.0120.10.0+11
Other Middle-Eastern peoples
230.10.1110.10.1+12
Czech
220.10.1310.10.1-10
Argentinian
220.10.1260.10.1-4
Albanian
220.10.3170.10.3+5
Slovene
220.10.090.00.1+13
Timorese
210.10.3220.10.3-1
Malay
200.10.2350.20.2-15
Latvian
190.10.0210.10.1-2
Other British
190.10.0100.00.0+9
Other Central Asian
180.10.3120.10.5+6
Other North American
180.10.130.00.1+15
Burmese peoples
180.10.160.00.1+12
Colombian
180.10.150.00.1+12
Hazara
180.13.7--------
Nepalese
170.10.230.00.1+14
Japanese
160.10.1130.10.1+3
Zimbabwean
160.10.1240.10.1-9
Sudanese
160.10.240.00.2+12
Taiwanese
150.10.040.00.0+11
Lithuanian
150.10.070.00.0+8
Other Southern/South East European
140.10.0--------
South Sudanese
140.10.200.00.1+14
Salvadoran
130.10.260.00.2+7
Other South American
130.10.1120.10.1+1
Other South-East Asian
130.10.100.00.0+13
Other Arab peoples
130.10.000.00.0+13
Other North-Western European
120.10.030.00.0+9
Armenian
120.10.2160.10.2-4
Torres Strait Islander
120.10.100.00.0+12
Brazilian
110.10.000.00.0+11
Caribbean Islander
110.10.0140.10.0-3
Arab not further described
110.10.2110.10.10
Belgian
110.10.0160.10.0-6
Assyrian/Chaldean
100.00.1160.10.0-6
Other Eastern European
100.00.0100.00.00
Khmer (Cambodian)
100.01.260.00.9+4
Singaporean
100.00.1110.10.1-1
Syrian
100.00.100.00.1+10
Show me more!

Excludes ancestries with fewer than 10 responses (multi-response).
Ancestry, 2021
Ancestry, 2021 English, Casey Established: 21.8% Australian, Casey Established: 21.4% Irish, Casey Established: 5.1% Scottish, Casey Established: 5.2% Italian, Casey Established: 3.5% Chinese, Casey Established: 4.9% German, Casey Established: 2.3% Indian, Casey Established: 7.7% Dutch, Casey Established: 1.8% Sinhalese/Sri Lankan, Casey Established: 4.3% English, Berwick (Township-Beaconsfield): 34.8% Australian, Berwick (Township-Beaconsfield): 29.9% Irish, Berwick (Township-Beaconsfield): 10.1% Scottish, Berwick (Township-Beaconsfield): 9.7% Italian, Berwick (Township-Beaconsfield): 5.3% Chinese, Berwick (Township-Beaconsfield): 5.2% German, Berwick (Township-Beaconsfield): 3.7% Indian, Berwick (Township-Beaconsfield): 3.5% Dutch, Berwick (Township-Beaconsfield): 3.3% Sinhalese/Sri Lankan, Berwick (Township-Beaconsfield): 2.6%
Source: Australian Bureau of Statistics, Census of Population and Housing, 2021 (Usual residence data)
Compiled and presented in profile.id by .id (informed decisions).
Change in ancestry, 2011 to 2021
Change in ancestry, 2011 to 2021 English, Berwick (Township-Beaconsfield): -282 Australian, Berwick (Township-Beaconsfield): -816 Irish, Berwick (Township-Beaconsfield): +63 Scottish, Berwick (Township-Beaconsfield): +28 Italian, Berwick (Township-Beaconsfield): +9 Chinese, Berwick (Township-Beaconsfield): +739 German, Berwick (Township-Beaconsfield): -18 Indian, Berwick (Township-Beaconsfield): +374 Dutch, Berwick (Township-Beaconsfield): -79 Sinhalese/Sri Lankan, Berwick (Township-Beaconsfield): +170
Source: Australian Bureau of Statistics, Census of Population and Housing, 2011 and 2021 (Usual residence data)
Compiled and presented in profile.id by .id (informed decisions).

Dominant groups

Analysis of the ancestry responses of the population in Berwick (Township-Beaconsfield) in 2021 shows that the top five ancestries nominated were:

  • English (7,530 people or 34.8%)
  • Australian (6,465 people or 29.9%)
  • Irish (2,183 people or 10.1%)
  • Scottish (2,094 people or 9.7%)
  • Italian (1,139 people or 5.3%)

In combination these five ancestries account for 19,411 responses in total, or 89.77% of all responses.

The major differences between the ancestries of the population in Berwick (Township-Beaconsfield) and Casey Established were:

  • A larger percentage of people with English ancestry (34.8% compared to 21.8%)
  • A larger percentage of people with Australian ancestry (29.9% compared to 21.4%)
  • A larger percentage of people with Irish ancestry (10.1% compared to 5.1%)
  • A larger percentage of people with Scottish ancestry (9.7% compared to 5.2%)

Emerging groups

The largest changes in the reported ancestries of the population in this area between 2011 and 2021 were:

  • Australian (-816 persons)
  • Chinese (+739 persons)
  • Indian (+374 persons)
  • English (-282 persons)

To continue building your demographic story go to...

v20.11.10-1.0.0