Lynwood
Household income quartiles
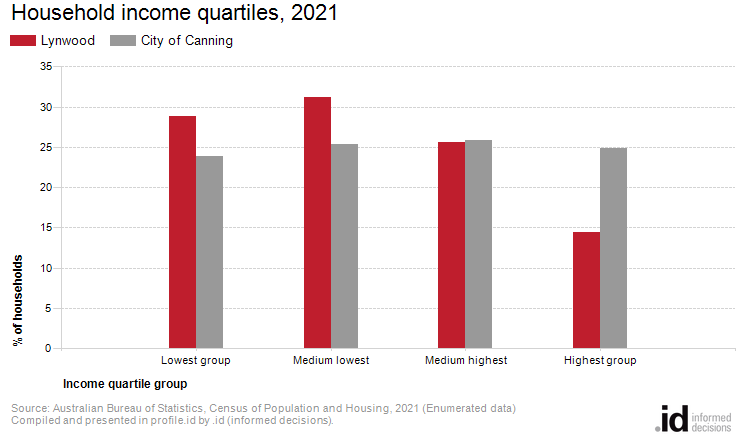
In Lynwood, the 'medium lowest' quartile was the largest group in 2021, comprising 31% of households with income.
Households form the common 'economic unit' in our society. Household Income is one of the most important indicators of socio-economic status. With other data sources, such as Qualifications and Occupation, it helps to reveal Lynwood's socio-economic status and economic opportunities. Household income levels are not comparable over time because of the influences of economic change such as wage level fluctuations and inflation. The income quartile method is a powerful and objective way of looking at income data and in particular, how it is changing.
A detailed explanation of how Household Income quartiles are calculated and interpreted is available in specific data notes.
Learn more about the characteristics of low-income households here.
Derived from the Census question:
'What is the total of all wages/salaries, government benefits, pensions, allowances and other income the person usually receives?'
Households
| Household income quartiles | ||||||||
|---|---|---|---|---|---|---|---|---|
| Lynwood - Households (Enumerated) | 2021 | 2016 | Change | |||||
| Quartile group | Number | % | City of Canning % | Number | % | City of Canning % | 2016 to 2021 | |
| Lowest group | 356 | 28.8 | 23.9 | 31001 | 304 | 26.9 | 25.1 | +52 |
| Medium lowest | 385 | 31.2 | 25.4 | 31002 | 363 | 32.0 | 25.6 | +22 |
| Medium highest | 316 | 25.6 | 25.9 | 31003 | 306 | 27.1 | 25.1 | +10 |
| Highest group | 178 | 14.4 | 24.8 | 31004 | 158 | 14.0 | 24.2 | +20 |
| Total Households | 1,237 | 100.0 | 100.0 | 1,134 | 100.0 | 100.0 | +103 | |
Source: Australian Bureau of Statistics, Census of Population and Housing (opens a new window) 2016 and 2021. Compiled and presented by .id (opens a new window)(informed decisions).
(Enumerated data)
| Household income - Quartile group dollar ranges | |||||||
|---|---|---|---|---|---|---|---|
| Calculated from income data for Western Australia | Weekly income by Census year | ||||||
| Household income ranges | 2021 | 2016 | 2011 | 2006 | 2001 | 1996 | 1991 |
| Lowest group | $0 to $888 | $0 to $790 | $0 to $693 | $0 to $565 | $0 to $416 | $0 to $348 | $0 to $305 |
| Medium lowest | $889 to $1,804 | $791 to $1,582 | $694 to $1,405 | $566 to $1,062 | $417 to $783 | $349 to $651 | $306 to $556 |
| Medium highest | $1,805 to $3,032 | $1,583 to $2,614 | $1,406 to $2,507 | $1,063 to $1,774 | $784 to $1,311 | $652 to $1,094 | $557 to $910 |
| Highest group | $3,033 and over | $2,615 and over | $2,508 and over | $1,775 and over | $1,312 and over | $1,095 and over | $911 and over |
Compiled and presented in profile.id by .id (informed decisions).
Compiled and presented in profile.id by .id (informed decisions).
Dominant groups
Income quartiles allow us to compare relative income-earning capabilities across time. Analysis of the distribution of households by income quartile in Lynwood compared to City of Canning shows that there was lesser proportion of households in the highest income quartile and a greater proportion in the lowest income quartile.
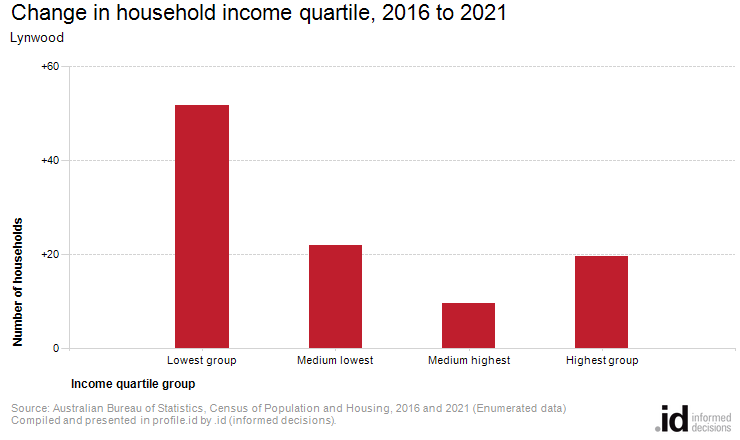
Emerging groups
The most significant change in Lynwood between 2016 and 2021 was in the lowest quartile which showed an increase of 52 households.