St James
Birthplace
In 2016, 42.4% of people in St James were born overseas, compared with 37.5% in Ferndale.
Country of Birth data identifies where people were born and is indicative of the level of cultural diversity in St James. The mix of Country of Birth groups is also indicative of historical settlement patterns, as source countries for Australia's immigration program have varied significantly over time.
To get a more complete picture of cultural and ethnic characteristics, St James's Country of Birth data should be viewed together with Ancestry, Language Spoken at Home and Religion.
Please note: Due to changes in ABS rules around perturbation and additivity of data to protect the confidentiality of individuals, counts of individual birthplace groups and totals derived from them may differ slightly from those published by the ABS. For more information see notes on data confidentiality.
Derived from the Census question:
'In which country was the person born?'
Total population
| Birthplace - Summary | ||||||||
|---|---|---|---|---|---|---|---|---|
| St James - Total persons (Usual residence) | 2016 | 2011 | Change | |||||
| Birthplace | Number | % | Ferndale % | Number | % | Ferndale % | 2011 to 2016 | |
| 1,203 | 42.4 | 37.5 | 38000 | 1,116 | 42.2 | 35.2 | +87 | |
| Australia | 1,369 | 48.3 | 58.4 | 38004 | 1,331 | 50.4 | 60.0 | +38 |
| Not stated | 265 | 9.3 | 4.2 | 38006 | 196 | 7.4 | 4.8 | +69 |
| Total Population | 2,837 | 100.0 | 100.0 | 2,643 | 100.0 | 100.0 | +194 | |
Source: Australian Bureau of Statistics, Census of Population and Housing (opens a new window) 2011 and 2016. Compiled and presented by .id (opens a new window)(informed decisions).
| Birthplace - Ranked by size | ||||||||
|---|---|---|---|---|---|---|---|---|
| St James - Overseas born (Usual residence) | 2016 | 2011 | Change | |||||
| Birthplace | Number | % | Ferndale % | Number | % | Ferndale % | 2011 to 2016 | |
| 141 | 5.0 | 11.5 | 30036 | 151 | 5.7 | 12.7 | -10 | |
| 116 | 4.1 | 1.8 | 30013 | 96 | 3.6 | 1.8 | +20 | |
| 88 | 3.1 | 2.1 | 30005 | 79 | 3.0 | 1.1 | +9 | |
| 85 | 3.0 | 2.1 | 30020 | 109 | 4.1 | 2.2 | -24 | |
| New Zealand | 76 | 2.7 | 3.5 | 30023 | 74 | 2.8 | 3.5 | +2 |
| Pakistan | 51 | 1.8 | 0.4 | 30108 | 12 | 0.5 | 0.1 | +39 |
| Ireland | 43 | 1.5 | 0.4 | 30016 | 28 | 1.1 | 0.6 | +15 |
| 38 | 1.3 | 1.3 | 30027 | 18 | 0.7 | 0.9 | +20 | |
| 38 | 1.3 | 0.4 | 30029 | 14 | 0.5 | 0.1 | +24 | |
| Italy | 34 | 1.2 | 0.6 | 30017 | 47 | 1.8 | 1.0 | -13 |
| 29 | 1.0 | 0.9 | 30014 | 43 | 1.6 | 0.7 | -14 | |
| Hong Kong | 27 | 1.0 | 0.3 | 30012 | 24 | 0.9 | 0.5 | +3 |
| 22 | 0.8 | 1.5 | 30031 | 27 | 1.0 | 1.2 | -5 | |
| Burma (Myanmar) | 21 | 0.7 | 0.3 | 30070 | 19 | 0.7 | 0.6 | +2 |
| Iran | 20 | 0.7 | 0.3 | 30049 | 4 | 0.2 | 0.3 | +16 |
| Thailand | 19 | 0.7 | 0.4 | 30034 | 15 | 0.6 | 0.3 | +4 |
| Kenya | 16 | 0.6 | 0.1 | 30088 | 20 | 0.8 | 0.3 | -4 |
| Somalia | 15 | 0.5 | 0.1 | 30117 | 23 | 0.9 | -- | -8 |
| Bangladesh | 15 | 0.5 | 0.1 | 30063 | 18 | 0.7 | 0.1 | -3 |
| Vietnam | 15 | 0.5 | 0.3 | 30038 | 14 | 0.5 | 0.3 | +1 |
| Singapore | 15 | 0.5 | 1.1 | 30030 | 45 | 1.7 | 0.9 | -30 |
| Taiwan | 13 | 0.5 | 0.1 | 30058 | 8 | 0.3 | 0.1 | +5 |
| Mauritius | 12 | 0.4 | 0.2 | 30052 | 13 | 0.5 | 0.2 | -1 |
| Brazil | 11 | 0.4 | -- | 30067 | 3 | 0.1 | -- | +8 |
| Iraq | 11 | 0.4 | 0.4 | 30015 | 3 | 0.1 | 0.1 | +8 |
| Germany | 10 | 0.4 | 0.6 | 30010 | 10 | 0.4 | 0.5 | 0 |
| Sri Lanka | 10 | 0.4 | 0.9 | 30033 | 13 | 0.5 | 0.5 | -3 |
| Show me more! | ||||||||
Excludes countries of birth with fewer than 10 people.
Compiled and presented in profile.id by .id (informed decisions).
Compiled and presented in profile.id by .id (informed decisions).
Dominant groups
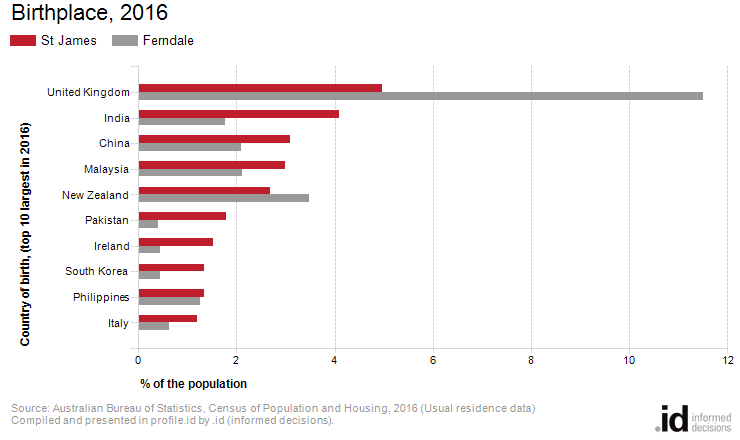
Analysis of the country of birth of the population in St James in 2016 compared to Ferndale shows that there was a larger proportion of people born overseas.
Overall, 42.4% of the population was born overseas, compared with 37.5% for Ferndale.
The major differences between the countries of birth of the population in St James and Ferndale were:
- A larger percentage of people born in India (4.1% compared to 1.8%)
- A larger percentage of people born in Pakistan (1.8% compared to 0.4%)
- A larger percentage of people born in Ireland (1.5% compared to 0.4%)
- A smaller percentage of people born in United Kingdom (5.0% compared to 11.5%)
Emerging groups
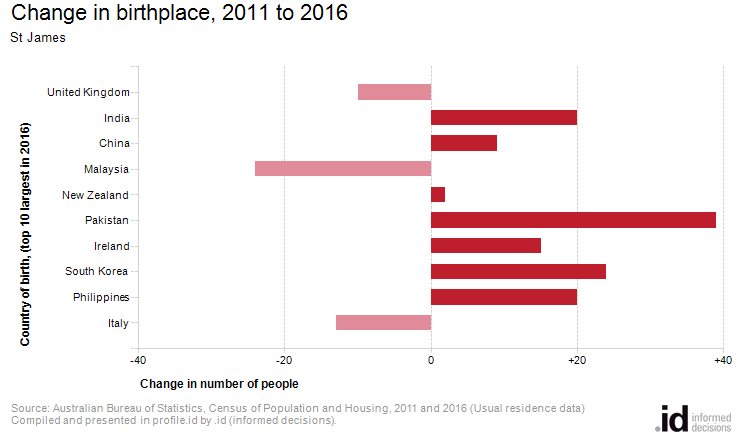
Between 2011 and 2016, the number of people born overseas increased by 87 or 7.8%.
There were no major differences in St James between 2011 and 2016.