Blacktown City
Age groups - Language spoken at home
In 2021, 38.5% of children aged [Parameter].[COIIDLabel] in Blacktown City spoke a language other than English at home.
Blacktown City's language statistics show the proportion of the population in the selected age group who speak a language at home other than English, and the main languages spoken. They indicate how culturally diverse a population is and the degree to which different ethnic groups and nationalities are retaining their language at different ages.
Blacktown City's language statistics should be analysed in conjunction with Country of Birth as different cultural groups are better analysed through the different topics. For major language groups, Community of Interest profiles are available for that specific language by a range of characteristics.
Derived from the Census question:
'Does the person use a language other than English at home?'
Children aged [Parameter].[COIIDLabel]
| Language spoken at home - Ranked by size | ||||||||
|---|---|---|---|---|---|---|---|---|
| Blacktown City - [Parameter].[COIIDLabel] | 2021 | 2011 | Change | |||||
| Language | Number | % | [Toggles].[BMACOIIDDisplayLabel] | Number | % | [Toggles].[BMACOIIDDisplayLabel] | 2011 to 2021 | |
| Punjabi | 1,794 | 6.0 | 0.2 | 651 | 2.6 | 0.4 | +1,143 | 30198 |
| Hindi | 845 | 2.8 | 0.4 | 770 | 3.0 | 1.2 | +75 | 30088 |
| Gujarati | 819 | 2.7 | 0.1 | 197 | 0.8 | 0.3 | +622 | 30081 |
| Urdu | 772 | 2.6 | 0.2 | 418 | 1.6 | 0.4 | +354 | 30257 |
| Non-verbal, so described | 736 | 2.5 | 0.0 | 551 | 2.2 | 0.1 | +185 | 30164 |
| Tamil | 590 | 2.0 | 0.2 | 264 | 1.0 | 0.5 | +326 | 30235 |
| Arabic | 560 | 1.9 | 1.0 | 639 | 2.5 | 4.1 | -79 | 30011 |
| Mandarin | 523 | 1.7 | 1.2 | 235 | 0.9 | 3.0 | +288 | 30144 |
| Nepali | 489 | 1.6 | 0.3 | 67 | 0.3 | 0.4 | +422 | 30162 |
| Telugu | 349 | 1.2 | 0.1 | 97 | 0.4 | 0.2 | +252 | 30237 |
| Bengali | 279 | 0.9 | 0.2 | 167 | 0.7 | 0.5 | +112 | 30026 |
| Tagalog | 260 | 0.9 | 0.2 | 345 | 1.4 | 0.8 | -85 | 30232 |
| Malayalam | 211 | 0.7 | 0.1 | 81 | 0.3 | 0.1 | +130 | 30141 |
| Filipino | 203 | 0.7 | 0.1 | 189 | 0.7 | 0.4 | +14 | 30066 |
| Samoan | 187 | 0.6 | 0.1 | 196 | 0.8 | 0.3 | -9 | 30204 |
| Persian (excluding Dari) | 185 | 0.6 | 0.1 | 84 | 0.3 | 0.3 | +101 | 30192 |
| Tongan | 183 | 0.6 | 0.0 | 105 | 0.4 | 0.2 | +78 | 30247 |
| Korean | 159 | 0.5 | 0.3 | 79 | 0.3 | 1.0 | +80 | 30121 |
| Dari | 153 | 0.5 | 0.0 | 136 | 0.5 | 0.1 | +17 | 30051 |
| Spanish | 144 | 0.5 | 0.3 | 141 | 0.6 | 1.1 | +3 | 30227 |
| Cantonese | 136 | 0.5 | 0.7 | 124 | 0.5 | 3.0 | +12 | 30035 |
| Turkish | 131 | 0.4 | 0.1 | 138 | 0.5 | 0.5 | -7 | 30253 |
| Sinhalese | 129 | 0.4 | 0.1 | 99 | 0.4 | 0.2 | +30 | 30215 |
| Marathi | 127 | 0.4 | 0.0 | 46 | 0.2 | 0.1 | +81 | 30149 |
| Hazaraghi | 102 | 0.3 | 0.0 | 22 | 0.1 | 0.1 | +80 | 30086 |
| Vietnamese | 98 | 0.3 | 0.5 | 61 | 0.2 | 1.9 | +37 | 30260 |
| Kannada | 91 | 0.3 | 0.0 | 17 | 0.1 | 0.0 | +74 | 30111 |
| Indonesian | 83 | 0.3 | 0.1 | 111 | 0.4 | 0.5 | -28 | 30103 |
| Pashto | 75 | 0.3 | 0.0 | 54 | 0.2 | 0.0 | +21 | 30191 |
| Greek | 59 | 0.2 | 0.3 | 74 | 0.3 | 1.8 | -15 | 30080 |
| Thai | 54 | 0.2 | 0.1 | 36 | 0.1 | 0.3 | +18 | 30239 |
| Dinka | 49 | 0.2 | 0.0 | 107 | 0.4 | 0.0 | -58 | 30053 |
| Russian | 42 | 0.1 | 0.1 | 45 | 0.2 | 0.4 | -3 | 30203 |
| Serbian | 36 | 0.1 | 0.1 | 35 | 0.1 | 0.4 | +1 | 30207 |
| Kurdish | 34 | 0.1 | 0.0 | 45 | 0.2 | 0.0 | -11 | 30125 |
| Portuguese | 33 | 0.1 | 0.1 | 21 | 0.1 | 0.3 | +12 | 30196 |
| French | 31 | 0.1 | 0.1 | 21 | 0.1 | 0.4 | +10 | 30070 |
| Chaldean Neo-Aramaic | 30 | 0.1 | 0.1 | 68 | 0.3 | 0.1 | -38 | 30040 |
| Croatian | 28 | 0.1 | 0.1 | 55 | 0.2 | 0.5 | -27 | 30045 |
| Fijian | 27 | 0.1 | 0.0 | 6 | 0.0 | 0.1 | +21 | 30064 |
| Italian | 26 | 0.1 | 0.3 | 27 | 0.1 | 1.6 | -1 | 30108 |
| Assyrian Neo-Aramaic | 26 | 0.1 | 0.1 | 26 | 0.1 | 0.4 | 0 | 30015 |
| Māori (New Zealand) | 24 | 0.1 | 0.0 | 16 | 0.1 | 0.0 | +8 | 30148 |
| Akan | 22 | 0.1 | 0.0 | 10 | 0.0 | 0.0 | +12 | 30006 |
| Burmese | 22 | 0.1 | 0.0 | 24 | 0.1 | 0.1 | -2 | 30032 |
| Indo-Aryan, nec | 22 | 0.1 | 0.0 | 4 | 0.0 | 0.0 | +18 | 30101 |
| Swahili | 19 | 0.1 | 0.0 | 3 | 0.0 | 0.0 | +16 | 30229 |
| Maltese | 17 | 0.1 | 0.0 | 28 | 0.1 | 0.3 | -11 | 30142 |
| Shona | 16 | 0.1 | 0.0 | 4 | 0.0 | 0.0 | +12 | 30211 |
| Tokelauan | 16 | 0.1 | 0.0 | 10 | 0.0 | 0.0 | +6 | 30246 |
| Armenian | 16 | 0.1 | 0.0 | 7 | 0.0 | 0.2 | +9 | 30012 |
| Afrikaans | 15 | 0.1 | 0.0 | 16 | 0.1 | 0.1 | -1 | 30005 |
| German | 15 | 0.1 | 0.1 | 20 | 0.1 | 0.4 | -5 | 30077 |
| Hungarian | 13 | 0.0 | 0.0 | 11 | 0.0 | 0.1 | +2 | 30092 |
| Japanese | 13 | 0.0 | 0.1 | 14 | 0.1 | 0.3 | -1 | 30109 |
| Konkani | 12 | 0.0 | 0.0 | 3 | 0.0 | 0.0 | +9 | 30120 |
| Fijian Hindustani | 12 | 0.0 | 0.0 | 15 | 0.1 | 0.0 | -3 | 30065 |
| Amharic | 12 | 0.0 | 0.0 | 5 | 0.0 | 0.0 | +7 | 30009 |
| Māori (Cook Island) | 12 | 0.0 | 0.0 | 14 | 0.1 | 0.0 | -2 | 30147 |
| Oriya | 12 | 0.0 | 0.0 | 3 | 0.0 | 0.0 | +9 | 30173 |
| Polish | 12 | 0.0 | 0.1 | 27 | 0.1 | 0.3 | -15 | 30195 |
| Romanian | 11 | 0.0 | 0.0 | 9 | 0.0 | 0.0 | +2 | 30200 |
| Other Southern Asian Languages | 11 | 0.0 | 0.0 | -- | 0.0 | 0.0 | -- | 30181 |
| Sindhi | 11 | 0.0 | 0.0 | 7 | 0.0 | 0.0 | +4 | 30214 |
| Auslan | 11 | 0.0 | 0.0 | 11 | 0.0 | 0.0 | 0 | 30016 |
| African Languages, nec | 10 | 0.0 | 0.0 | 5 | 0.0 | 0.0 | +5 | 30003 |
| Albanian | 10 | 0.0 | 0.0 | 4 | 0.0 | 0.0 | +6 | 30007 |
| Bosnian | 10 | 0.0 | 0.0 | 12 | 0.0 | 0.1 | -2 | 30030 |
| Dutch | 10 | 0.0 | 0.0 | 9 | 0.0 | 0.1 | +1 | 30056 |
| Show me more! | ||||||||
Source: Australian Bureau of Statistics, Census of Population and Housing (opens a new window) 2011 and 2021. Compiled and presented by .id (opens a new window)(informed decisions).
Excludes languages with fewer than 10 people speaking them at home.
| Language spoken at home - Summary | ||||||||
|---|---|---|---|---|---|---|---|---|
| Blacktown City - [Parameter].[COIIDLabel] | 2021 | 2011 | Change | |||||
| Language summary | Number | % | [Toggles].[BMACOIIDDisplayLabel] | Number | % | [Toggles].[BMACOIIDDisplayLabel] | 2011 to 2021 | |
| Speaks English only | 16,241 | 54.3 | 57.6 | 16,538 | 65.0 | 62.2 | -297 | 60500 |
| Non-English total | 11,522 | 38.5 | 37.0 | 7,146 | 28.1 | 32.4 | +4,376 | 60510 |
| Not stated | 2,147 | 7.2 | 5.4 | 1,776 | 7.0 | 5.4 | +371 | 60520 |
| Total people | 29,910 | 100.0 | 100.0 | 25,460 | 100.0 | 100.0 | +4,450 | |
Source: Australian Bureau of Statistics, Census of Population and Housing (opens a new window) 2011 and 2021. Compiled and presented by .id (opens a new window)(informed decisions).
Dominant groups
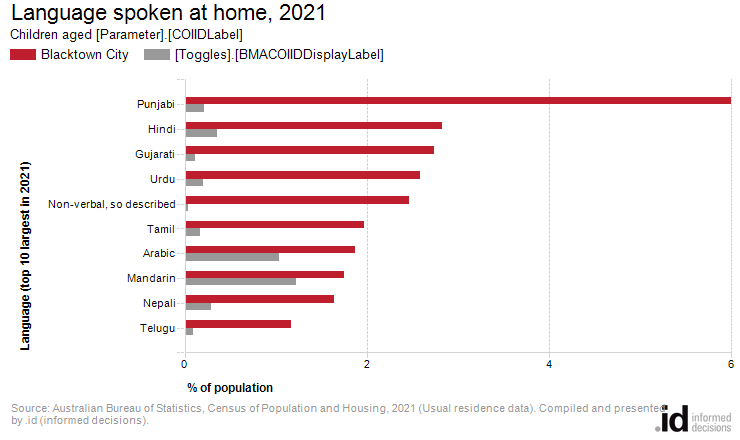
Analysis of the language spoken at home by children aged [Parameter].[COIIDLabel] in Blacktown City in 2021 compared to [Parameter].[BMACOIIDLabel] shows that there was a smaller proportion of people who spoke English only, and a larger proportion of those speaking a non-English language (either exclusively, or in addition to English).
Overall, 54.3% of children aged [Parameter].[COIIDLabel] spoke English only, and 38.5% spoke a non-English language, compared with 57.6% and 37.0% respectively for [Parameter].[BMACOIIDLabel].
Other than English, the dominant language spoken at home by children aged [Parameter].[COIIDLabel] in Blacktown City was Punjabi, with 6.0% of the population, or 1,794 people speaking this language at home.
The major differences between the languages spoken at home for children aged [Parameter].[COIIDLabel] of Blacktown City and [Parameter].[BMACOIIDLabel] in 2021 were:
- A larger percentage speaking Punjabi at home (6.0% compared to 0.2%)
- A larger percentage speaking Gujarati at home (2.7% compared to 0.1%)
- A larger percentage speaking Hindi at home (2.8% compared to 0.4%)
- A larger percentage speaking Non-verbal, so described at home (2.5% compared to 0.0%)
Emerging groups
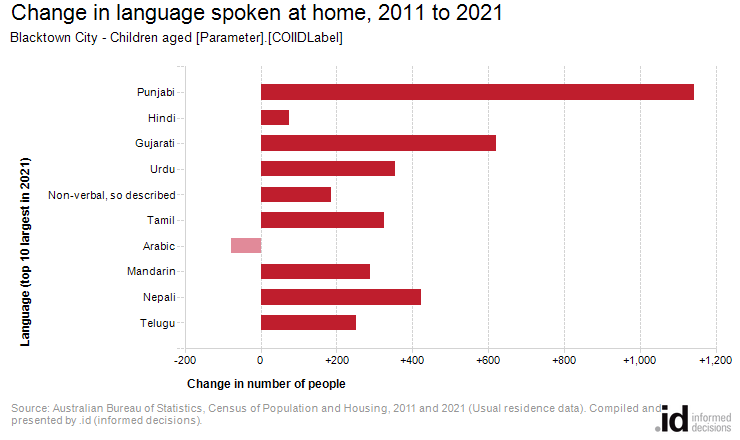
Between 2011 and 2021, the number of children aged [Parameter].[COIIDLabel] who spoke a language other than English at home increased by 4,376 or 61.2%, and the number of people who spoke English only decreased by 297 or 1.8%.
The largest changes in the spoken languages of children aged [Parameter].[COIIDLabel] in Blacktown City between 2011 and 2021 were for those speaking:
- Punjabi (+1,143 persons)
- Gujarati (+622 persons)
- Nepali (+422 persons)
- Urdu (+354 persons)