Canberra
Proficiency in English
In Canberra in 2016, 4,815 males who spoke a language other than English at home reported difficulty speaking English.
Proficiency in English measures the self-assessed proficiency in spoken English of people who speak a language other than English at home. The data, when viewed with other ethnic and cultural indicators, such as Ancestry, Country of Birth, Language Spoken at Home and Religion, reflects Canberra's ethnic composition and how long the overseas born have been in Australia. This helps service providers determine whether they need to communicate with the local population in languages other than English.
Derived from the Census question:
'How well does the person speak English?'
Total population
| Proficiency in English | ||||||||
|---|---|---|---|---|---|---|---|---|
| Canberra - Total males (Usual residence) | 2016 | 2011 | Change | |||||
| English proficiency | Number | % | Australia % | Number | % | Australia % | 2011 to 2016 | |
| Speaks English only | 142,856 | 73.1 | 72.9 | 4001 | 137,349 | 77.9 | 76.6 | +5,507 |
| Speaks English well or very well | 36,721 | 18.8 | 17.3 | 4002 | 27,671 | 15.7 | 15.2 | +9,050 |
| Speaks English not well or not at all | 4,815 | 2.5 | 3.1 | 4003 | 3,412 | 1.9 | 2.7 | +1,403 |
| Not stated | 11,043 | 5.7 | 6.7 | 4005 | 7,990 | 4.5 | 5.5 | +3,053 |
| Total population | 195,435 | 100.0 | 100.0 | 176,422 | 100.0 | 100.0 | +19,013 | |
Source: Australian Bureau of Statistics, Census of Population and Housing (opens a new window) 2011 and 2016. Compiled and presented by .id (opens a new window)(informed decisions).
Compiled and presented in profile.id by .id (informed decisions).

Compiled and presented in profile.id by .id (informed decisions).
Dominant groups
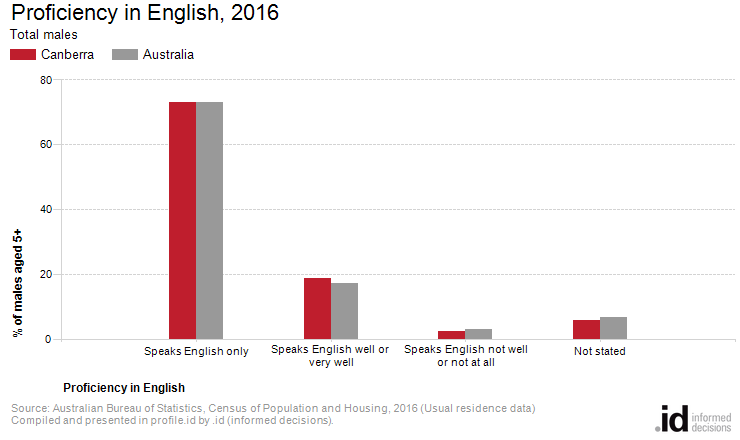
Analysis of the proficiency in English data of the male population in Canberra in 2016 compared to Australia shows that there was a similar proportion of males who spoke English only, and a lower proportion of males who spoke another language and English not well or not at all.
Overall, 73.1% of males spoke English only, and 2.5% spoke another language and English not well or not at all, compared with 72.9% and 3.1% respectively for Australia.
Emerging groups
The most significant changes in the proficiency in English of the male population in this area between 2011 and 2016 were in those speaking:
- Speaks English well or very well (+9,050 males)
- Speaks English only (+5,507 males)
- Speaks English not well or not at all (+1,403 males)