Australia
Aboriginal and Torres Strait Islander profile - Service age groups
The age structure of Aboriginal and Torres Strait Islander peoples of Australia provides insights into the demand for age-based services. Typically Aboriginal and Torres Strait Islander populations around Australia have a younger age structure than the total population, but age structures vary greatly between areas.
Service age groups combine age groups which are likely to be at a similar life stage and consume similar services from Local Government. For instance this view of population combines primary, secondary and tertiary education age population into discrete groups, which can’t be seen in the uniform 5-year age group categories.
To get a more complete picture, Australia's Aboriginal and Torres Strait Islander Age Structure should be viewed in conjunction with Household Types and Highest Level of Schooling information.
Derived from the Census question:
'What is the person's date of birth (or age last birthday)?'
Total population
| Service age groups | ||||||||
|---|---|---|---|---|---|---|---|---|
| Aboriginal and Torres Strait Islander peoples - Australia | 2021 | 2006 | Change | |||||
| Service age group (years) | Number | % | New South Wales - First Nations % | Number | % | New South Wales - First Nations % | 2006 to 2021 | |
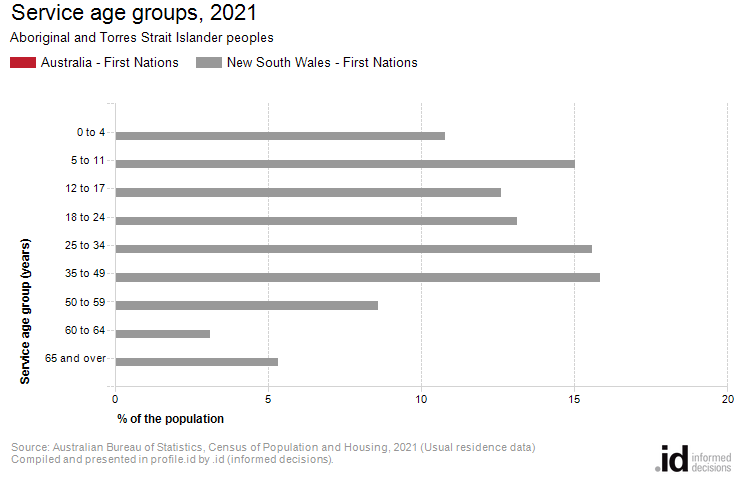
| 0 to 4 | -- | -- | 10.8 | -- | -- | -- | -- | 1000 |
| 5 to 11 | -- | -- | 15.0 | -- | -- | -- | -- | 1001 |
| 12 to 17 | -- | -- | 12.6 | -- | -- | -- | -- | 1002 |
| 18 to 24 | -- | -- | 13.1 | -- | -- | -- | -- | 1003 |
| 25 to 34 | -- | -- | 15.6 | -- | -- | -- | -- | 1004 |
| 35 to 49 | -- | -- | 15.8 | -- | -- | -- | -- | 1005 |
| 50 to 59 | -- | -- | 8.6 | -- | -- | -- | -- | 1006 |
| 60 to 64 | -- | -- | 3.1 | -- | -- | -- | -- | 1007 |
| 65 and over | -- | -- | 5.3 | -- | -- | -- | -- | 1008 |
| Total people | -- | -- | 100.0 | -- | -- | -- | -- | 9999 |
Source: Australian Bureau of Statistics, Census of Population and Housing (opens a new window) 2006 and 2021. Compiled and presented by .id (opens a new window)(informed decisions).
(Usual residence data)
Compiled and presented in profile.id by .id (informed decisions).
Compiled and presented in profile.id by .id (informed decisions).
Dominant groups
Analysis of the Aboriginal and Torres Strait Islander service age groups in Australia in 2021 compared to the Aboriginal and Torres Strait Islander population in New South Wales shows that there was a similar proportion of people in the younger age groups (0 to 17 years) and a higher proportion of people in the older age group (65+ years).
Overall, 38.8% of the Aboriginal and Torres Strait Islander population in Australia was aged between 0 and 17, and 5.9% were aged 65 years and over, compared with 38.4% and 5.3% respectively for the Aboriginal and Torres Strait Islander population in New South Wales.
The major differences between the age groups of the Aboriginal and Torres Strait Islander population in Australia and the Aboriginal and Torres Strait Islander population in New South Wales were:
- A smaller percentage of people aged 25 to 34 years (14.5% compared to 15.6%)
- A smaller percentage of people aged 18 to 24 years (12.4% compared to 13.1%)