Australian Capital Territory
Unpaid domestic work
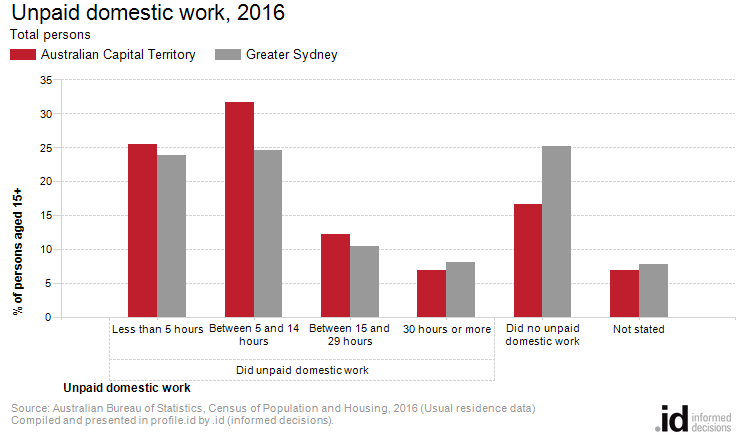
In Australian Capital Territory 19.2% of the population over 15 did more than 14 hours of housework each week in 2016.
There has been increased interest in identifying, acknowledging and valuing the unpaid work that supports home and community life. The changing amount of time spent on unpaid housework in different Household Types and, particularly the distribution of this work within the household, can indicate the changing roles of males, females and older children in society. The level of unpaid domestic work in Australian Capital Territory may also be related to Household Income, as higher income households are able to outsource some of these tasks.
Derived from the Census question:
'In the last week did the person spend time doing unpaid domestic work for their household?'
Persons aged 15 years and over.
| Unpaid domestic work | ||||||||
|---|---|---|---|---|---|---|---|---|
| Australian Capital Territory - Persons aged 15+ (Usual residence) | 2016 | 2011 | Change | |||||
| Hours spent on unpaid domestic work | Number | % | Greater Sydney % | Number | % | Greater Sydney % | 2011 to 2016 | |
| Did unpaid domestic work | 246,424 | 76.4 | 67.0 | 226,407 | 78.0 | 67.6 | +20,017 | 10001 |
| Less than 5 hours | 82,357 | 25.5 | 23.8 | 75,524 | 26.0 | 23.4 | +6,833 | 10002 |
| Between 5 and 14 hours | 102,078 | 31.7 | 24.6 | 91,039 | 31.4 | 24.5 | +11,039 | 10003 |
| Between 15 and 29 hours | 39,391 | 12.2 | 10.4 | 37,278 | 12.8 | 10.8 | +2,113 | 10004 |
| 30 hours or more | 22,598 | 7.0 | 8.1 | 22,566 | 7.8 | 8.9 | +32 | 10005 |
| Did no unpaid domestic work | 53,853 | 16.7 | 25.2 | 46,383 | 16.0 | 23.8 | +7,470 | 10006 |
| Not stated | 22,143 | 6.9 | 7.8 | 17,522 | 6.0 | 8.6 | +4,621 | 10007 |
| Total persons aged 15+ | 322,420 | 100.0 | 100.0 | 290,312 | 100.0 | 100.0 | +32,108 | |
Source: Australian Bureau of Statistics, Census of Population and Housing (opens a new window) 2011 and 2016. Compiled and presented by .id (opens a new window)(informed decisions).
Compiled and presented in profile.id by .id (informed decisions).
Compiled and presented in profile.id by .id (informed decisions).
Dominant groups
Analysis of the unpaid domestic work performed by the population in Australian Capital Territory in 2016 compared to Greater Sydney shows that there was a higher proportion of persons who performed 15 hours or more of unpaid domestic work per week.
Overall, 19.2% of the population reported performing 15 hours or more of unpaid domestic work, compared with 18.5% for Greater Sydney.
The major differences between the share of the population performing unpaid domestic work in Australian Capital Territory and Greater Sydney were:
- A larger percentage of persons who did unpaid domestic work (total) (76.4% compared to 67.0%)
- A larger percentage of persons who did between 5 and 14 hours of domestic work (31.7% compared to 24.6%)
- A larger percentage of persons who did between 15 and 29 hours of domestic work (12.2% compared to 10.4%)
- A smaller percentage of persons who did no unpaid domestic work (16.7% compared to 25.2%)
Emerging groups
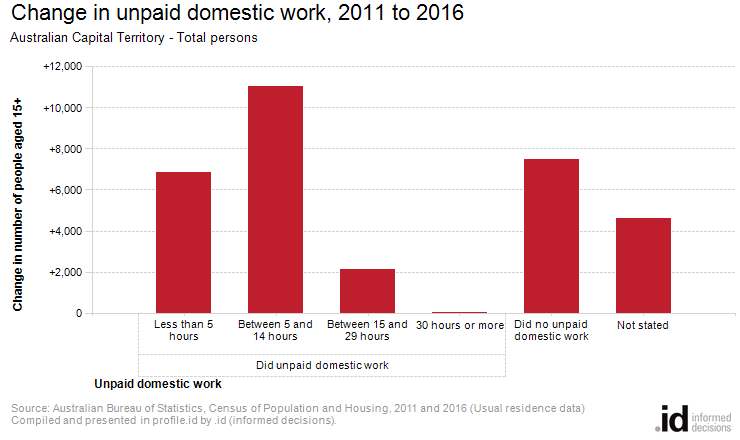
The largest changes in the number of people performing unpaid domestic work in Australian Capital Territory, between 2011 and 2016 were those who:
- Did unpaid domestic work (+20,017 persons)
- Did between 5 and 14 hours of domestic work (+11,039 persons)
- Did no unpaid domestic work (+7,470 persons)
- Did less than 5 hours of domestic work (+6,833 persons)