Albury City
Overseas born - Number of cars per household
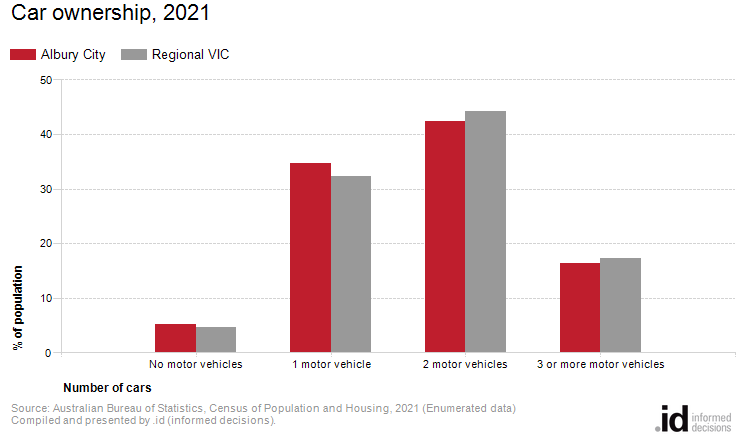
In Albury City, 58.8% of people [Toggles].[COIIDDisplayLabel] had access to two or more motor vehicles.
The ability of the population to access services and employment is strongly influenced by access to transport. The number of motor vehicles per household in Albury City quantifies access to private transport for those born overseas.
The number of motor vehicles among the overseas-born population may be influenced by a variety of factors, such as the Age Structure of that population, ability to drive and availability of other transport options (eg. public transport) in the area of residence.
Number of motor vehicles data should also be viewed in conjunction with Number of Bedrooms and Household Size, as well as atlas maps showing the location of overseas-born population, to build up the story of migrant communities in Albury City.
Derived from the Census question:
'How many registered motor vehicles owned or used by residents of this dwelling were garaged or parked at or near this dwelling on the night of 10 August 2021?'
People [Toggles].[COIIDDisplayLabel], counted in private dwellings
| Car ownership | ||||||||
|---|---|---|---|---|---|---|---|---|
| Albury City - [Toggles].[COIIDDisplayLabel] | 2021 | 2016 | Change | |||||
| Number of cars | Number | % | Regional VIC | Number | % | Regional VIC | 2016 to 2021 | |
| No motor vehicles | 360 | 5.3 | 4.6 | 309 | 5.8 | 5.5 | +51 | 26001 |
| 1 motor vehicle | 2,352 | 34.6 | 32.4 | 2,012 | 37.6 | 35.3 | +340 | 26002 |
| 2 motor vehicles | 2,882 | 42.4 | 44.2 | 2,156 | 40.3 | 41.9 | +726 | 26003 |
| 3 or more motor vehicles | 1,109 | 16.3 | 17.3 | 684 | 12.8 | 13.9 | +425 | 26004 |
| Not stated | 89 | 1.3 | 1.5 | 188 | 3.5 | 3.3 | -99 | 26005 |
| Total people counted in private dwellings | 6,792 | 100.0 | 100.0 | 5,349 | 100.0 | 100.0 | +1,443 | |
Source: Australian Bureau of Statistics, Census of Population and Housing (opens a new window) 2016 and 2021. Compiled and presented by .id (opens a new window)(informed decisions).
Compiled and presented by .id (informed decisions).
Compiled and presented by .id (informed decisions).
Dominant groups
Analysis of the car ownership of people [Toggles].[COIIDDisplayLabel] in Albury City in 2021 compared to Regional VIC shows that 93.4% of people [Toggles].[COIIDDisplayLabel] were in households that owned at least one car, while 5.3% did not, compared with 93.9% and 4.6% respectively in Regional VIC.
Of those that owned at least one vehicle, there was a larger proportion that owned just one car; a smaller proportion owned two cars; and a smaller proportion that owned three cars or more.
Overall, 34.6% of people [Toggles].[COIIDDisplayLabel] were in households that owned one car; 42.4% owned two cars; and 16.3% owned three cars or more, compared with 32.4%; 44.2% and 17.3% respectively for Regional VIC.
Emerging groups
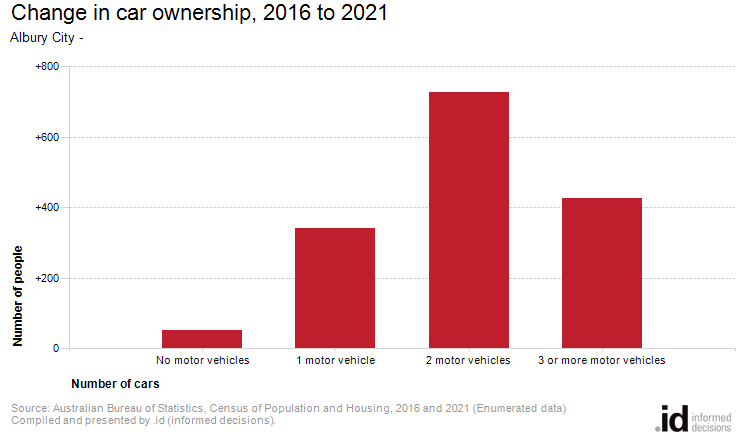
The largest changes in household car ownership for people [Toggles].[COIIDDisplayLabel] in Albury City between 2016 and 2021 were:
- 2 motor vehicles (+726 persons)
- 3 or more motor vehicles (+425 persons)
- 1 motor vehicle (+340 persons)
- No motor vehicles (+51 persons)