Parkes Shire
Ancestry
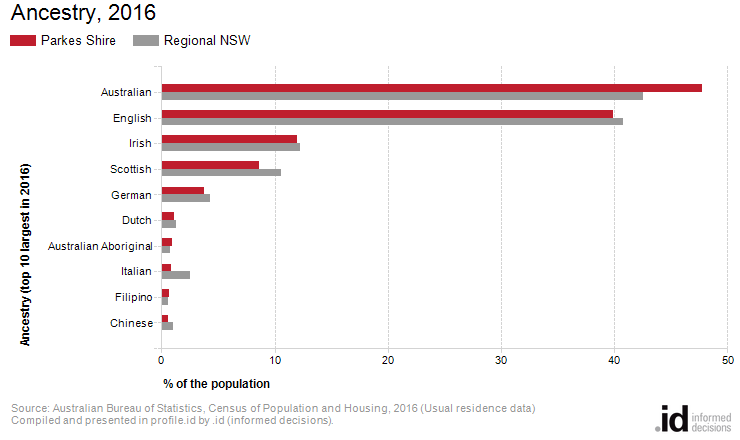
The three largest ancestries in Parkes Shire in 2016 were Australian, English and Irish.
Ancestry defines the cultural association and ethnic background of an individual going back three generations. Ancestry is a good measure of the total size of cultural groups in Parkes Shire regardless of where they were born or what language they speak.
Ancestry data, should be combined with data on Birthplace, Language Spoken at Home and Religion for a more complete picture of Parkes Shire's ethnic characteristics.
Please note that the "Australian Aboriginal" and "Torres Strait Islander" categories in this topic are not directly comparable from 2021 to previous years, due to a change in the wording of the question. In 2021, these options were marked boxes on the question rather than write-in options. The "Aboriginal and Torres Strait Islander Origin" question is still considered a more reliable count for this group, and can be found on the Population summary page.
Please note: Due to changes in ABS rules around perturbation and additivity of data to protect the confidentiality of individuals, counts of ancestry groups and totals derived from them may differ slightly from those published by the ABS. For more information see notes on data confidentiality.
Derived from the Census question:
'What is the person's ancestry?'
Multi-response
Total population
| Ancestry - Totals | ||||||||
|---|---|---|---|---|---|---|---|---|
| Parkes Shire - Total persons (Usual residence) | 2016 | 2011 | Change | |||||
| Ancestry totals | Number | % | Regional NSW % | Number | % | Regional NSW % | 2011 to 2016 | |
| Not stated | 1,439 | 8.1 | 6.0 | 1,259 | 7.1 | 5.4 | +180 | 37500 |
| Total responses | 17,860 | -- | -- | 17,686 | -- | -- | +174 | 37502 |
| Total people | 14,606 | -- | -- | 14,592 | -- | -- | +14 | |
Source: Australian Bureau of Statistics, Census of Population and Housing (opens a new window) 2011 and 2016. Compiled and presented by .id (opens a new window)(informed decisions).
| Ancestry - Ranked by size | ||||||||
|---|---|---|---|---|---|---|---|---|
| Parkes Shire - Total persons (Usual residence) | 2016 | 2011 | Change | |||||
| Ancestry | Number | % | Regional NSW % | Number | % | Regional NSW % | 2011 to 2016 | |
| Australian | 6,981 | 47.8 | 42.5 | 37010 | 6,927 | 47.5 | 43.1 | +54 |
| English | 5,829 | 39.9 | 40.8 | 37033 | 5,944 | 40.7 | 40.4 | -115 |
| Irish | 1,754 | 12.0 | 12.3 | 37050 | 1,750 | 12.0 | 11.7 | +4 |
| Scottish | 1,266 | 8.7 | 10.5 | 37100 | 1,223 | 8.4 | 10.0 | +43 |
| German | 545 | 3.7 | 4.3 | 37041 | 537 | 3.7 | 4.2 | +8 |
| Dutch | 160 | 1.1 | 1.3 | 37031 | 136 | 0.9 | 1.3 | +24 |
| Australian Aboriginal | 138 | 0.9 | 0.8 | 37011 | 114 | 0.8 | 0.6 | +24 |
| Italian | 130 | 0.9 | 2.6 | 37051 | 143 | 1.0 | 2.5 | -13 |
| Filipino | 101 | 0.7 | 0.6 | 37038 | 61 | 0.4 | 0.4 | +40 |
| Chinese | 91 | 0.6 | 1.0 | 37024 | 67 | 0.5 | 0.8 | +24 |
| New Zealander | 67 | 0.5 | 0.6 | 37070 | 63 | 0.4 | 0.6 | +4 |
| Welsh | 58 | 0.4 | 0.7 | 37124 | 55 | 0.4 | 0.7 | +3 |
| Polish | 52 | 0.4 | 0.6 | 37093 | 51 | 0.3 | 0.5 | +1 |
| Indian | 49 | 0.3 | 0.7 | 37046 | 20 | 0.1 | 0.4 | +29 |
| French | 42 | 0.3 | 0.5 | 37040 | 45 | 0.3 | 0.4 | -3 |
| Inadequately Described | 35 | 0.2 | 0.3 | 37045 | 27 | 0.2 | 0.2 | +8 |
| Maltese | 34 | 0.2 | 0.5 | 37064 | 37 | 0.3 | 0.4 | -3 |
| Lebanese | 33 | 0.2 | 0.2 | 37060 | 41 | 0.3 | 0.2 | -8 |
| South African | 29 | 0.2 | 0.2 | 37108 | 19 | 0.1 | 0.2 | +10 |
| Spanish | 26 | 0.2 | 0.3 | 37109 | 22 | 0.2 | 0.3 | +4 |
| Maori | 25 | 0.2 | 0.3 | 37065 | 13 | 0.1 | 0.3 | +12 |
| Greek | 23 | 0.2 | 0.6 | 37042 | 17 | 0.1 | 0.6 | +6 |
| American | 23 | 0.2 | 0.2 | 37004 | 20 | 0.1 | 0.3 | +3 |
| Tongan | 21 | 0.1 | 0.1 | 37118 | 15 | 0.1 | 0.1 | +6 |
| Danish | 20 | 0.1 | 0.2 | 37030 | 10 | 0.1 | 0.2 | +10 |
| Croatian | 18 | 0.1 | 0.3 | 37027 | 14 | 0.1 | 0.3 | +4 |
| Indonesian | 18 | 0.1 | 0.1 | 37047 | 6 | 0.0 | 0.1 | +12 |
| Korean | 17 | 0.1 | 0.1 | 37056 | 7 | 0.0 | 0.1 | +10 |
| Fijian | 16 | 0.1 | 0.1 | 37037 | 15 | 0.1 | 0.1 | +1 |
| Swiss | 15 | 0.1 | 0.1 | 37112 | 8 | 0.1 | 0.1 | +7 |
| Thai | 14 | 0.1 | 0.2 | 37116 | 9 | 0.1 | 0.1 | +5 |
| Ukrainian | 14 | 0.1 | 0.1 | 37121 | 14 | 0.1 | 0.1 | 0 |
| Portuguese | 14 | 0.1 | 0.2 | 37094 | 3 | 0.0 | 0.2 | +11 |
| Czech | 12 | 0.1 | 0.1 | 37029 | 3 | 0.0 | 0.1 | +9 |
| Norwegian | 11 | 0.1 | 0.1 | 37071 | 12 | 0.1 | 0.1 | -1 |
| Russian | 10 | 0.1 | 0.2 | 37097 | 13 | 0.1 | 0.2 | -3 |
| Samoan | 10 | 0.1 | 0.1 | 37099 | 6 | 0.0 | 0.1 | +4 |
| Iraqi | 10 | 0.1 | 0.0 | 37049 | 10 | 0.1 | 0.0 | 0 |
| Show me more! | ||||||||
Excludes ancestries with fewer than 10 responses (multi-response).
Compiled and presented in profile.id by .id (informed decisions).
Compiled and presented in profile.id by .id (informed decisions).
Dominant groups
Analysis of the ancestry responses of the population in Parkes Shire in 2016 shows that the top five ancestries nominated were:
- Australian (6,981 people or 47.8%)
- English (5,829 people or 39.9%)
- Irish (1,754 people or 12.0%)
- Scottish (1,266 people or 8.7%)
- German (545 people or 3.7%)
In combination these five ancestries account for 16,375 responses in total, or 112.11% of all responses.
The major differences between the ancestries of the population in Parkes Shire and Regional NSW were:
- A larger percentage of people with Australian ancestry (47.8% compared to 42.5%)
- A smaller percentage of people with Scottish ancestry (8.7% compared to 10.5%)
- A smaller percentage of people with Italian ancestry (0.9% compared to 2.6%)
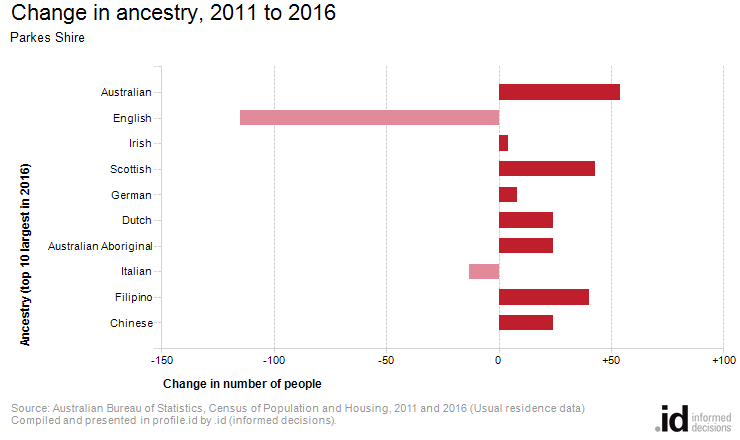
Emerging groups
The largest changes in the reported ancestries of the population in this area between 2011 and 2016 were:
- English (-115 persons)
- Australian (+54 persons)