Flemington (N)
Housing tenure
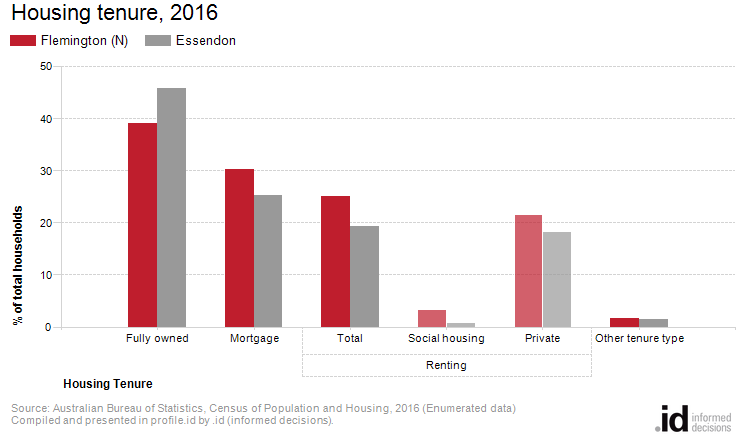
In Flemington (N), 69% of households were purchasing or fully owned their home, 21.5% were renting privately, and 3.4% were in social housing in 2016.
Flemington (N)'s Housing Tenure data provides insights into its socio-economic status as well as the role it plays in the housing market. For example, a high concentration of private renters may indicate a transient area attractive to young singles and couples, while a concentration of home owners indicates a more settled area with mature families and empty-nesters (Household Summary). Tenure can also reflect built form (Dwelling Type), with a significantly higher share of renters in high density housing and a substantially larger proportion of home-owners in separate houses, although this is not always the case.
In conjunction with other socio-economic status indicators in Flemington (N), Tenure data is useful for analysing housing markets, housing affordability and identifying public housing areas.
Further reading: How can Councils influence affordable housing.
Derived from the Census questions:
'Is this dwelling (owned outright, owned with a mortgage etc.)', and 'If this dwelling is being rented, who is it rented from?'
Households
| Housing tenure | ||||||||
|---|---|---|---|---|---|---|---|---|
| Flemington (N) - Households (Enumerated) | 2016 | 2011 | Change | |||||
| Tenure type | Number | % | Essendon % | Number | % | Essendon % | 2011 to 2016 | |
| 204 | 39.1 | 45.9 | 222 | 42.4 | 49.7 | -18 | 22001 | |
| 157 | 30.2 | 25.4 | 153 | 29.2 | 24.8 | +5 | 22002 | |
| Renting - Total | 130 | 25.0 | 19.3 | 120 | 23.0 | 18.7 | +10 | 22003 |
| 18 | 3.4 | 0.9 | 19 | 3.6 | 0.7 | -1 | 22004 | |
| 112 | 21.5 | 18.4 | 101 | 19.4 | 17.9 | +11 | 22005 | |
| Renting - Not stated | 0 | 0.0 | -- | 0 | 0.0 | -- | 0 | 22006 |
| Other tenure type | 8 | 1.7 | 1.5 | 0 | 0.0 | 0.8 | +9 | 22007 |
| Not stated | 21 | 4.1 | 8.0 | 28 | 5.5 | 6.0 | -7 | 22008 |
| Total households | 522 | 100.0 | 100.0 | 524 | 100.0 | 100.0 | -3 | |
Source: Australian Bureau of Statistics, Census of Population and Housing (opens a new window) 2011 and 2016. Compiled and presented by .id (opens a new window)(informed decisions).
(Enumerated data)
Compiled and presented in profile.id by .id (informed decisions).
Compiled and presented in profile.id by .id (informed decisions).
Dominant groups
Analysis of the housing tenure of households of Flemington (N) in 2016 compared to Essendon shows that there was a smaller proportion of households who owned their dwelling; a larger proportion purchasing their dwelling; and a larger proportion who were renters.
Overall, 39.1% of households owned their dwelling; 30.2% were purchasing, and 25.0% were renting, compared with 45.9%, 25.4% and 19.3% respectively for Essendon.
Emerging groups
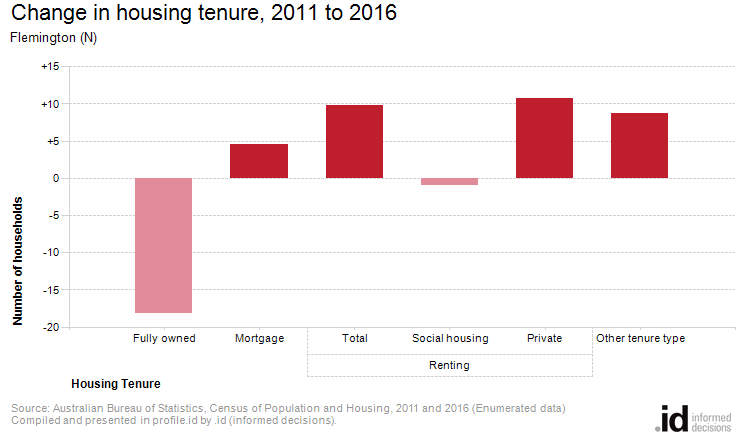
There were no major differences in Flemington (N) between 2011 and 2016.
The total number of households in Flemington (N) decreased by 2 between 2011 and 2016.