City of Moonee Valley
Migration by age
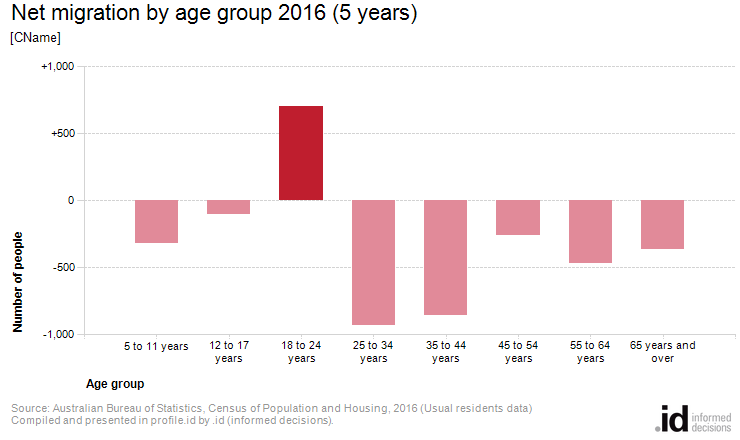
In 2016, the age group with the highest net migration to the City of Moonee Valley was persons aged 18 to 24 years.
The age structure of people who move into and out of the City of Moonee Valley is strongly influenced by the residential role and function of the area and can influence demand for particular services. For instance, inner city areas near employment, education and entertainment tend to attract many young people in their late teens and early twenties, who move out in their late twenties and thirties to start families in suburban areas. Rural areas tend to lose young people and gain older families and retirees.
Understanding the City of Moonee Valley's attraction to different age groups helps to plan services for the community as well as advocating with other levels of government and private enterprise to provide infrastructure, employment opportunities and facilities which may help to retain age groups which are otherwise leaving the area.
To see annual migration patterns (outside the Census), please refer to the Annual migration by location page. Note - please use this with caution as currently the annual migration numbers are based on pre-Census change-of-address records and may not match the numbers on this page from the 2021 Census
Derived from the Census questions:
'Where does the person usually live?' and 'Where did the person usually live five years ago (at 10 August 2016)'.
Please note: Although this page references the Developing East Arnhem area, the data given is based on the East Arnhem LGA.
| Migration by age group 2016 | ||||
|---|---|---|---|---|
| City of Moonee Valley | ||||
| Age group | In migration | Out migration | Net migration | |
| 5 to 11 years | +1,720 | -2,040 | -320 | 101 |
| 12 to 17 years | +932 | -1,037 | -105 | 102 |
| 18 to 24 years | +2,375 | -1,669 | +706 | 103 |
| 25 to 34 years | +7,904 | -8,832 | -928 | 104 |
| 35 to 44 years | +5,245 | -6,099 | -854 | 105 |
| 45 to 54 years | +2,404 | -2,662 | -258 | 106 |
| 55 to 64 years | +1,314 | -1,779 | -465 | 107 |
| 65 years and over | +1,396 | -1,763 | -367 | 108 |
| Total population | +23,290 | -25,881 | -2,591 | 109 |
Source: Australian Bureau of Statistics, Census of Population and Housing (opens a new window), 2016 (Usual Residence Data). Compiled and presented in profile.id by .id (opens a new window)(informed decisions).
Compiled and presented in profile.id by .id (informed decisions).