Moonee Ponds (N)
Housing loan repayments
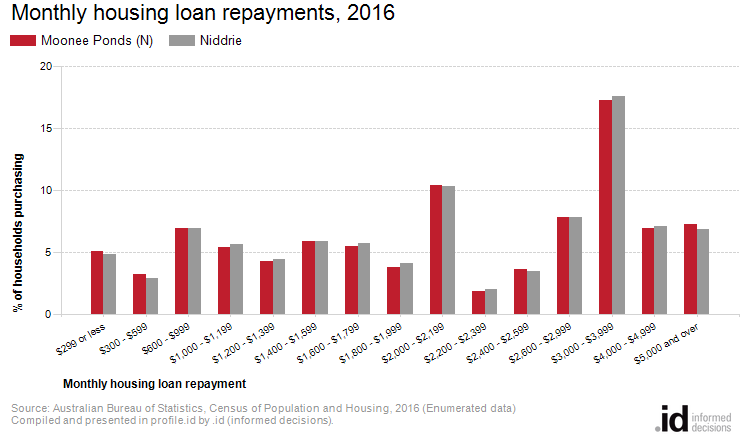
In Moonee Ponds (N), 39.3% of households with a mortgage were making high loan repayments of $2,600 or more per month in 2016.
Mortgage repayments are directly related to house prices in Moonee Ponds (N), length of occupancy and the level of equity of home owners. When viewed with Household Income data it may also indicate the level of housing stress households in the community are under. In mortgage belt areas it is expected that households will be paying a higher proportion of their income on their housing compared to well-established areas. First home buyer areas are also likely to have larger mortgages than upgrader areas where households move in with equity from elsewhere.
Mortgage payment levels are not directly comparable over time because of inflation. For comparison of mortgage payments over time, go to Housing Loan Quartiles.
Please note, interest rates at the 2021 Census were at a record low in Australia. The first interest rate rises by the Reserve Bank began an upward cycle from May 2022. Please use mortgage payment data with caution as data from the 2021 Census pre-dates all official rate rises in the current cycle.
Further reading: How can Councils influence affordable housing.
Derived from the Census questions:
'How much does your household pay for this dwelling?' and 'Is this dwelling (owned outright, owned with a mortgage etc.)'
Households with a mortgage
| Monthly housing loan repayments | |||||||
|---|---|---|---|---|---|---|---|
| Moonee Ponds (N) - Households (Enumerated) | 2016 | ||||||
| Monthly repayment amount | Number | % | Niddrie % | ||||
| $299 or less | 75 | 5.1 | 4.8 | 23020 | |||
| $300 - $599 | 47 | 3.2 | 2.9 | 23021 | |||
| $600 - $999 | 103 | 7.0 | 6.9 | 23022 | |||
| $1,000 - $1,199 | 80 | 5.4 | 5.6 | 23023 | |||
| $1,200 - $1,399 | 63 | 4.3 | 4.4 | 23024 | |||
| $1,400 - $1,599 | 87 | 5.9 | 5.8 | 23025 | |||
| $1,600 - $1,799 | 81 | 5.5 | 5.7 | 23026 | |||
| $1,800 - $1,999 | 56 | 3.8 | 4.1 | 23027 | |||
| $2,000 - $2,199 | 154 | 10.4 | 10.3 | 23028 | |||
| $2,200 - $2,399 | 27 | 1.8 | 2.0 | 23029 | |||
| $2,400 - $2,599 | 54 | 3.6 | 3.5 | 23030 | |||
| $2,600 - $2,999 | 116 | 7.8 | 7.8 | 23031 | |||
| $3,000 - $3,999 | 256 | 17.3 | 17.6 | 23032 | |||
| $4,000 - $4,999 | 103 | 7.0 | 7.1 | 23033 | |||
| $5,000 and over | 107 | 7.2 | 6.9 | 23034 | |||
| Not stated | 71 | 4.8 | 4.5 | 23035 | |||
| Total | 1,480 | 100.0 | 100.0 | ||||
Source: Australian Bureau of Statistics, Census of Population and Housing (opens a new window) 2016. Compiled and presented in profile.id by .id (opens a new window)(informed decisions).
(Enumerated data)
Compiled and presented in profile.id by .id (informed decisions).
Dominant groups
Analysis of the monthly housing loan repayments of households in Moonee Ponds (N) compared to Niddrie shows that there was a similar proportion of households paying high mortgage repayments ($2,600 per month or more), as well as a similar proportion of households with low mortgage repayments (less than $1,200 per month).
Overall, 39.3% of households were paying high mortgage repayments, and 20.6% were paying low repayments, compared with 39.3% and 20.3% respectively in Niddrie.
There were no major differences between Moonee Ponds (N) and Niddrie in 2016.