Thornleigh
Family blending
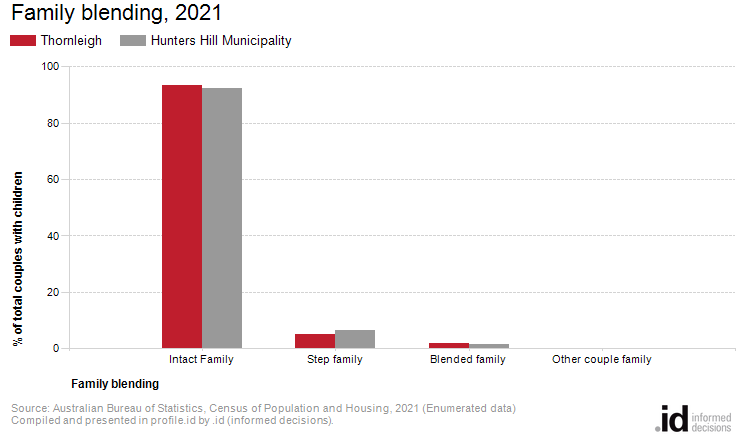
In 2021, Thornleigh had 5.0% of couple families with children in step families and 1.6% in blended families.
Information on blended and intact families can be an indicator of the level of family breakup and repartnering within the area, and a potential indicator of socio-economic disadvantage. Family blending only applies to couple families with children. For information more broadly about household and family types, including single-parent families, please see Household Type, Households with Children, and Households without Children.
Derived from the Census question:
'What is the person's relationship (to each other person in the household)?'
Couple families with children
| Family blending | ||||||||
|---|---|---|---|---|---|---|---|---|
| Thornleigh - Total couples with children (Enumerated) | 2021 | 2016 | Change | |||||
| Family blending by type | Number | % | Hunters Hill Municipality % | Number | % | Hunters Hill Municipality % | 2016 to 2021 | |
| Intact Family | 1,303 | 93.3 | 92.1 | 1,247 | 94.0 | 94.6 | +56 | 19601 |
| Step family | 70 | 5.0 | 6.5 | 48 | 3.6 | 4.1 | +22 | 19602 |
| Blended family | 23 | 1.6 | 1.3 | 32 | 2.4 | 1.3 | -9 | 19603 |
| Other couple family | 0 | -- | -- | 0 | -- | -- | 0 | 19604 |
| Total couples with children | 1,396 | 100.0 | 100.0 | 1,327 | 100.0 | 100.0 | +69 | |
Source: Australian Bureau of Statistics, Census of Population and Housing (opens a new window) 2016 and 2021. Compiled and presented by .id (opens a new window)(informed decisions).
(Enumerated data)
Compiled and presented in profile.id by .id (informed decisions).
Compiled and presented in profile.id by .id (informed decisions).
Dominant groups
Analysis of the family blending in Thornleigh in 2021 compared to Hunters Hill Municipality shows that there was a lower proportion of step families as well as a lower proportion of blended families. Overall, 5.0% of total couple families with children were step families, and 1.6% were blended families, compared with 6.5% and 1.3% respectively for Hunters Hill Municipality.
There were a similar proportion of other families and a higher proportion of couples without children. Overall, the proportion of other families was 0.0% compared to 0.0% in Hunters Hill Municipality while the proportion of intact families was 93.3% compared to 92.1% in Hunters Hill Municipality.
Emerging groups
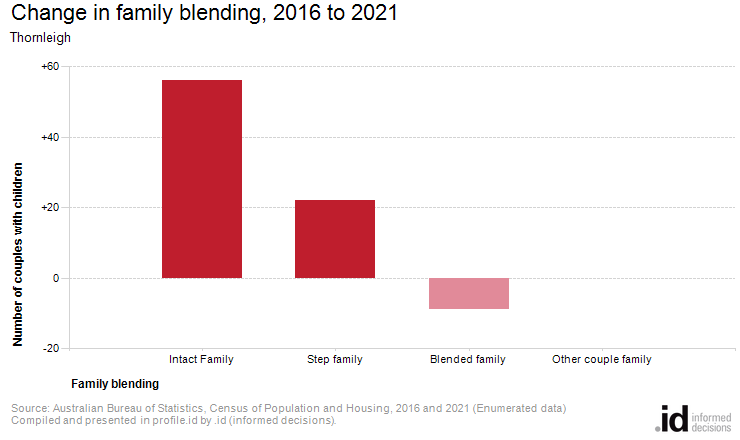
The number of couple families with children in Thornleigh increased by 69 between 2016 and 2021.
The largest change in family blending in Thornleigh between 2016 and 2021 was:
- Intact Family (+56 couples with children)