Hornsby Shire
Aboriginal and Torres Strait Islander profile - Occupations of employment
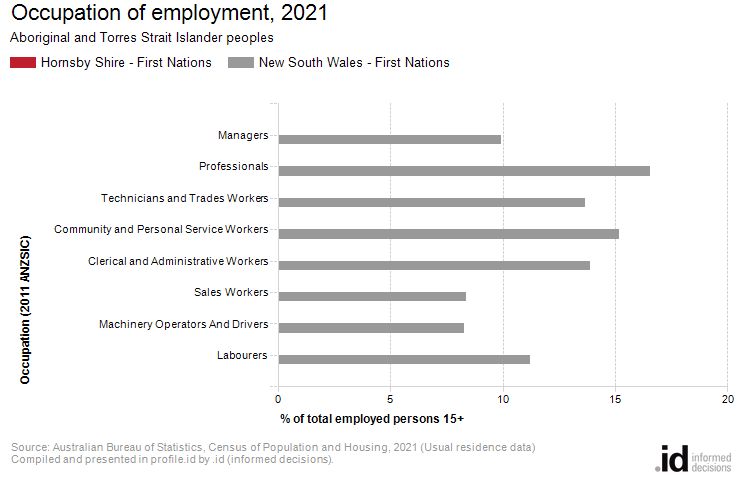
There are more Aboriginal and Torres Strait Islander people employed as professionals in Hornsby Shire than any other occupation.
Occupation statistics quantify the occupations in which the first nations residents work. The work locations may be within the local area or elsewhere. Only the employed population are counted in the occupation table (those unemployed or not in the labour force don’t have an occupation).
Occupations are broadly classified by education/skill level, with the more highly skilled managerial and professional occupations being at the top of the list, while labourers form the lowest level of the list.
The occupations of the first nations population will be influenced by the economic base and employment opportunities available in the area, education levels, and the working and social aspirations of the population. When viewed with other indicators, such as Highest Education Attainment and Employment Status, Occupation is a key measure for evaluating Hornsby Shire's socio-economic status and skill base.
Derived from the two Census questions:
'In the main job held last week, what was the person's occupation?' and 'What are the main tasks that the person himself/herself usually performs in that occupation?'
Persons aged 15 years and over
| Occupation of employment | ||||||||
|---|---|---|---|---|---|---|---|---|
| Aboriginal and Torres Strait Islander peoples - Hornsby Shire | 2021 | 2011 | Change | |||||
| Occupation | Number | % | New South Wales - First Nations % | Number | % | New South Wales - First Nations % | 2011 to 2021 | |
| Managers | -- | -- | 9.9 | -- | -- | 8.0 | -- | 15001 |
| Professionals | -- | -- | 16.6 | -- | -- | 15.3 | -- | 15002 |
| Technicians and Trades Workers | -- | -- | 13.7 | -- | -- | 13.1 | -- | 15003 |
| Community and Personal Service Workers | -- | -- | 15.2 | -- | -- | 15.6 | -- | 15004 |
| Clerical and Administrative Workers | -- | -- | 13.9 | -- | -- | 15.9 | -- | 15005 |
| Sales Workers | -- | -- | 8.4 | -- | -- | 8.8 | -- | 15006 |
| Machinery Operators And Drivers | -- | -- | 8.3 | -- | -- | 9.1 | -- | 15007 |
| Labourers | -- | -- | 11.2 | -- | -- | 11.4 | -- | 15008 |
| Not stated or inadequately described | -- | -- | 2.9 | -- | -- | 2.7 | -- | 15009 |
| Total employed people aged 15+ | -- | -- | 100.0 | -- | -- | 100.0 | -- | 99999 |
Source: Australian Bureau of Statistics, Census of Population and Housing (opens a new window) 2011 and 2021. Compiled and presented by .id (opens a new window)(informed decisions).
(Usual residence data)
Compiled and presented in profile.id by .id (informed decisions).

Compiled and presented in profile.id by .id (informed decisions).
Dominant groups
An analysis of the jobs held by the Aboriginal and Torres Strait Islander resident population in Hornsby Shire in 2021 shows the three most popular occupations were:
- Professionals (95 people or 23.9%)
- Technicians and Trades Workers (63 people or 15.8%)
- Managers (57 people or 14.3%)
In combination these three occupations accounted for 215 people in total or 54.0% of the employed Aboriginal and Torres Strait Islander resident population.
The major differences between the occupations held by the Aboriginal and Torres Strait Islander population of Hornsby Shire and the Aboriginal and Torres Strait Islander population of New South Wales were:
- A larger percentage of people employed as Professionals (23.9% compared to 16.6%)
- A larger percentage of people employed as Managers (14.3% compared to 9.9%)
- A smaller percentage of people employed as Machinery Operators And Drivers (3.5% compared to 8.3%)
- A smaller percentage of people employed as Community and Personal Service Workers (10.8% compared to 15.2%)